The Data Pipleline
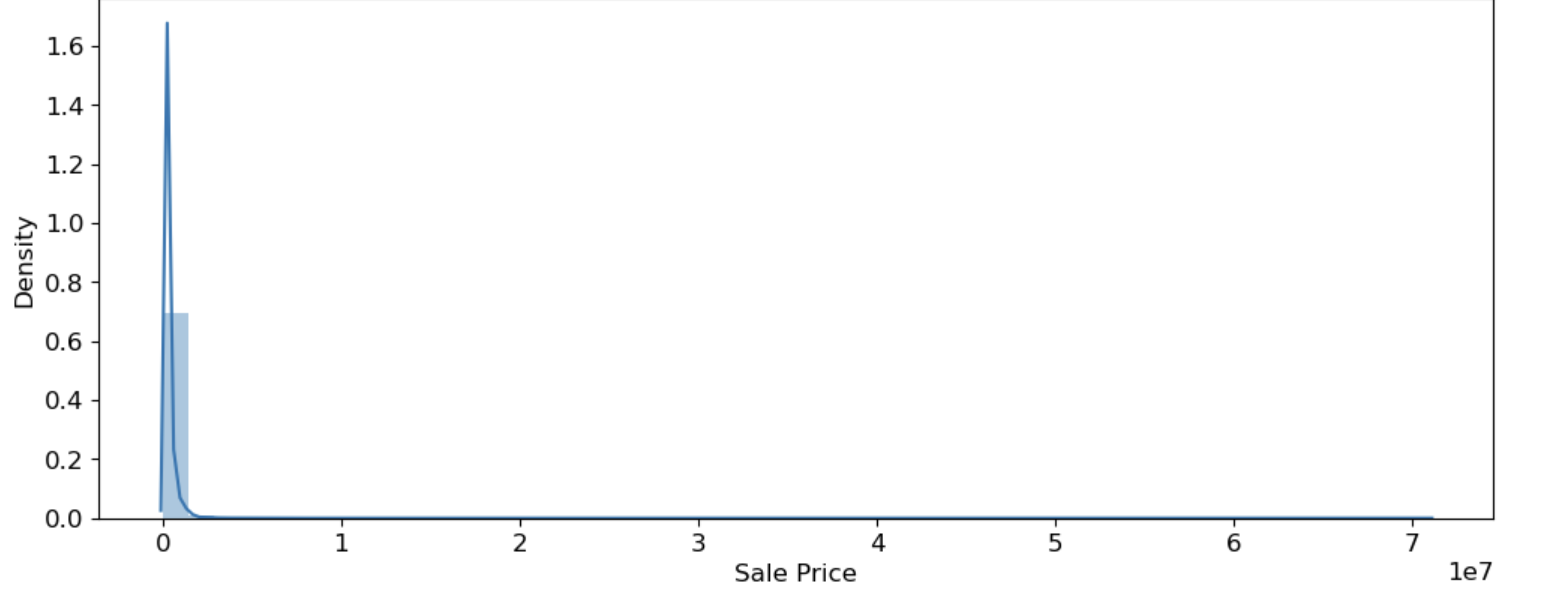
For each feature below, I cleaned the data by removing invalid data points as well as not including any outliers in the analysis and performing any transformation operations if needed. I first worked on the response variable, Sales Price. Click on image below to see the cleaned Sales Price distribution with a log transformation.
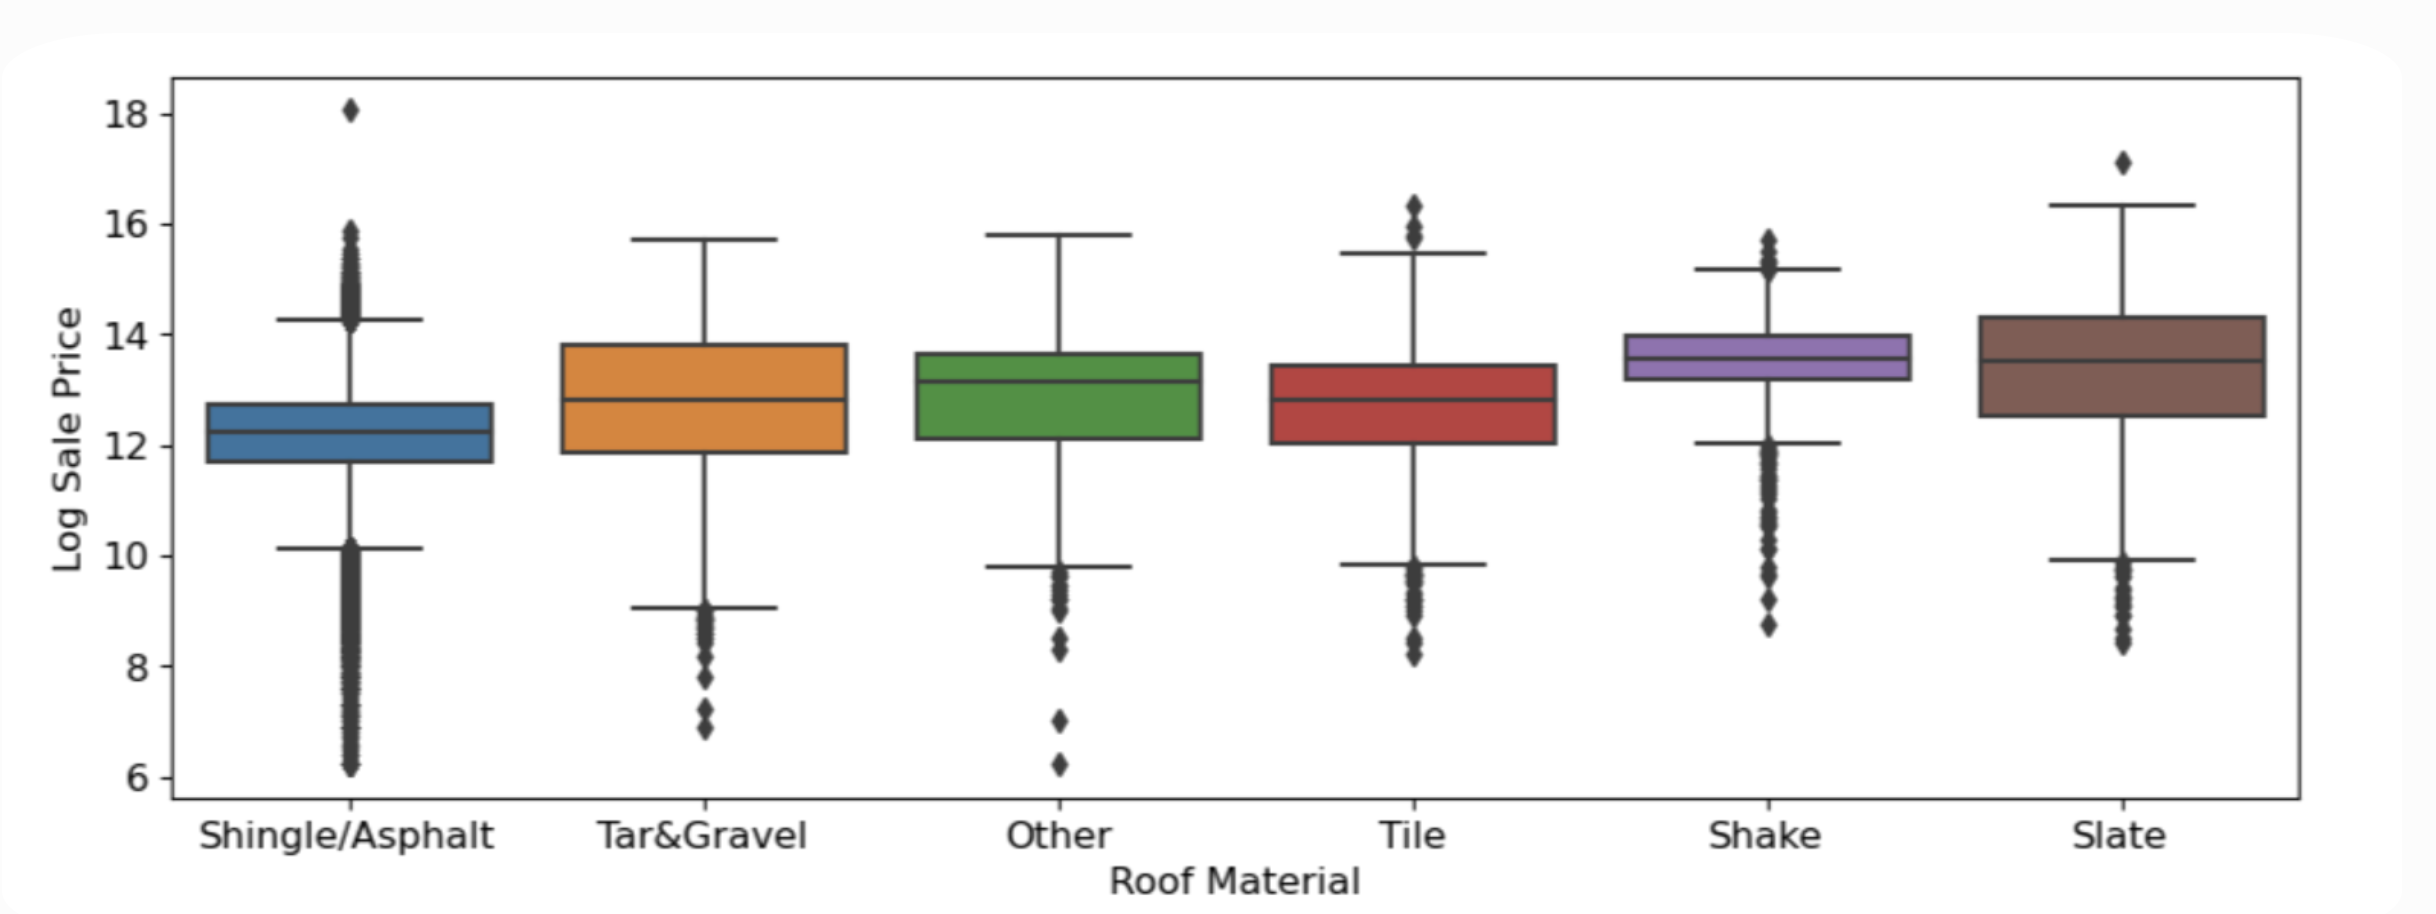
To include include the roof material into our predictor variables, I one hot encoded each of the different materials below, turning each into seperate indicator variables I added to each column. Click below on each box plot to see the distribution of their respective indicator variables.
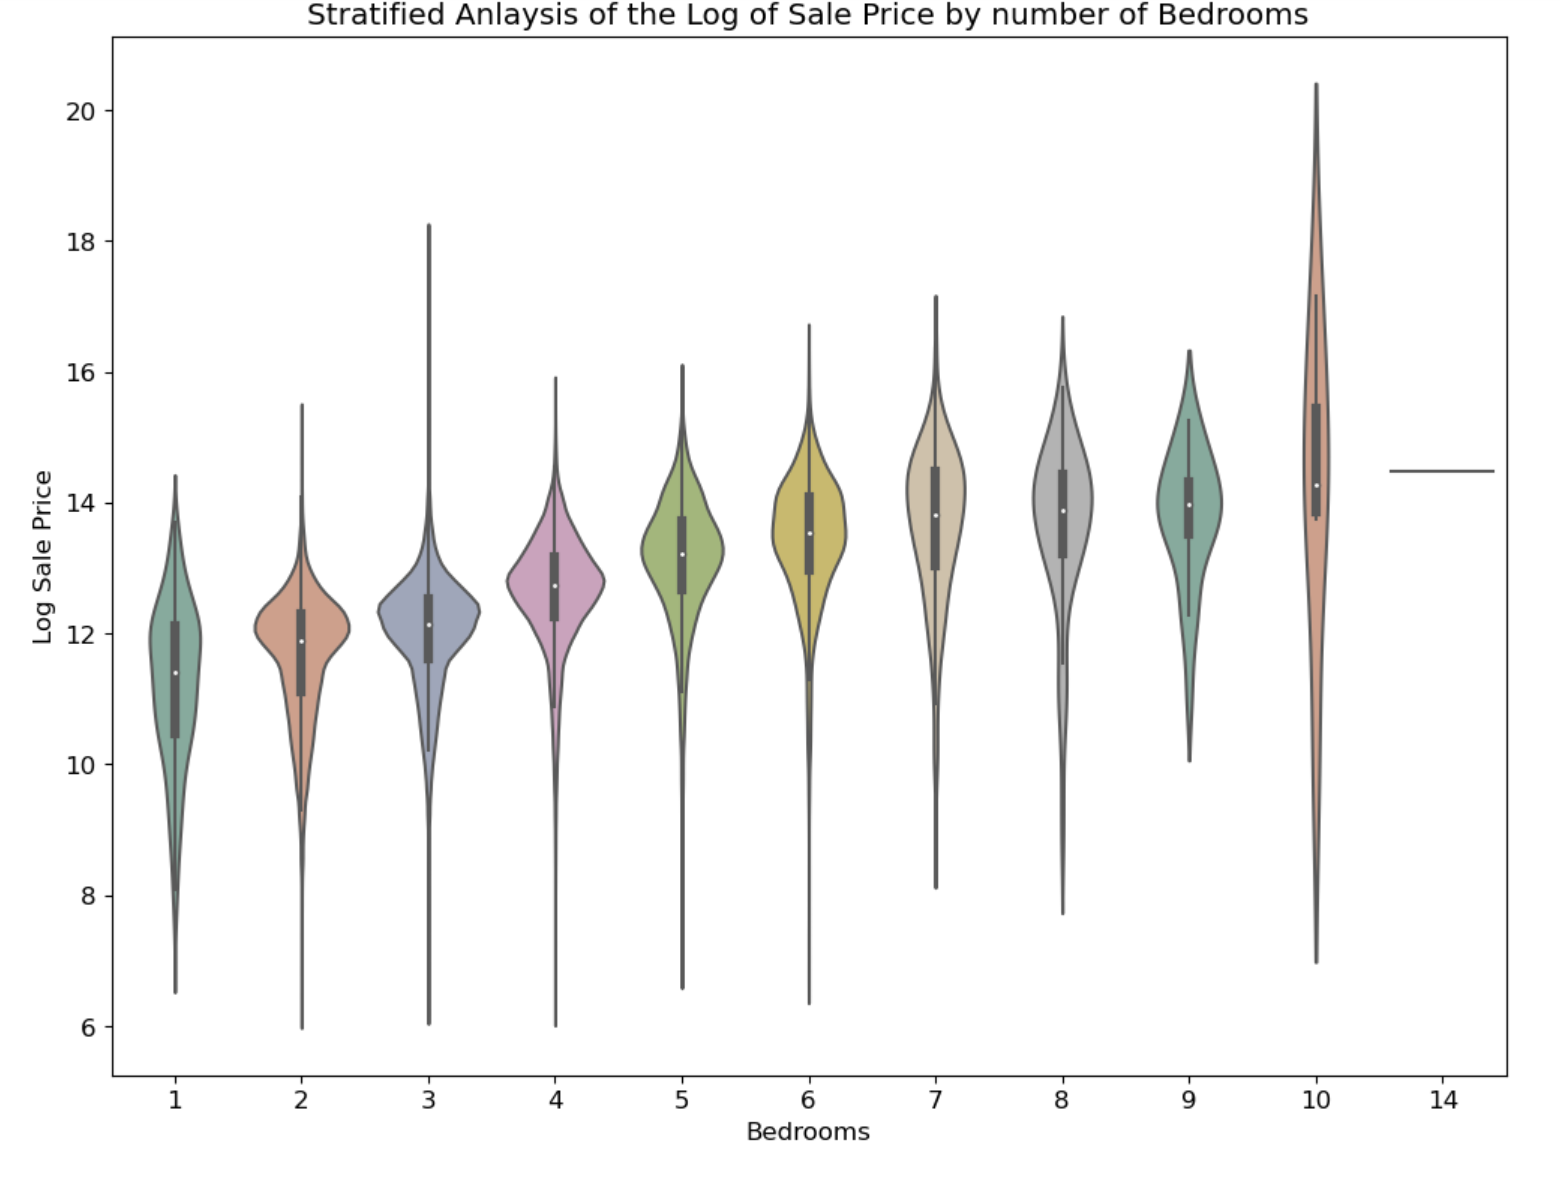
From the description of each housing listing, I also used regex to extract the number of bedrooms in each house, below is a violin plot showing the relationship between number of bedrooms and sale price
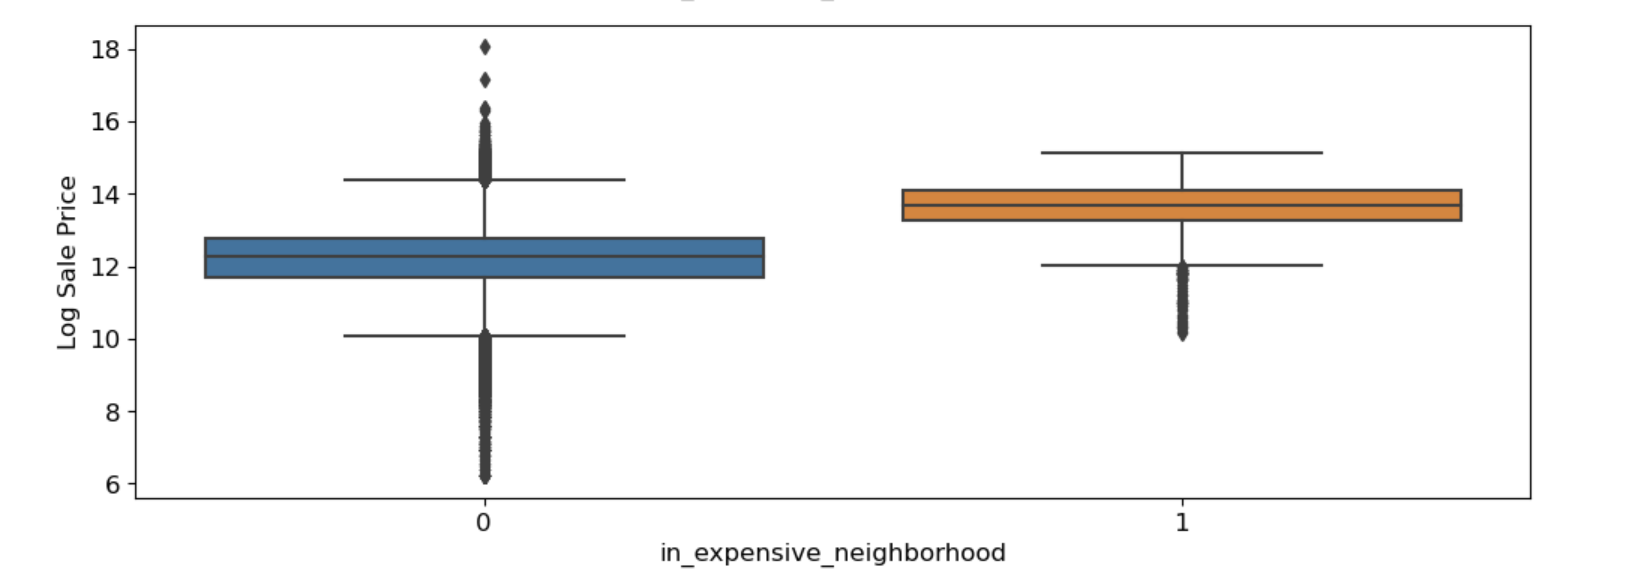
Also, I grouped houses that shared neighborhoods and found the top 3 most expensive neighborhoods using pandas, and created an indicator variable for it called "in_expensive_neighborhood".
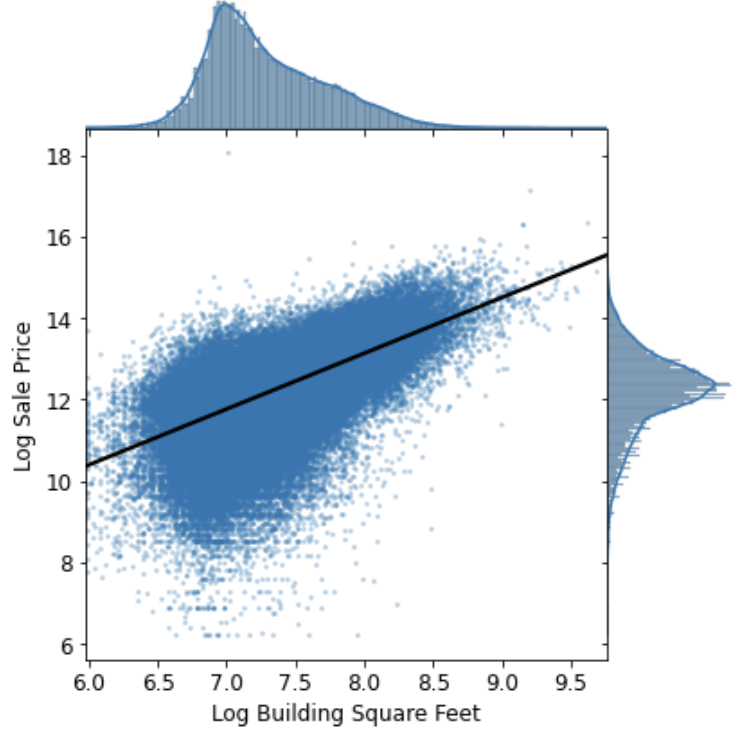
I then also took a look at the correlation between the area of each house and the sale price through a joint plot.
